High Stakes Examinations and
Educational Foolishness
Every
time I look at one of the exams being given by some state, or even the practice
problems exhibited on a web site by some publisher in self-praise, I find
something wrong – ignorant, askew, confusing, ambiguous, pretentious – something
deleterious to the putative purpose of the exercise or exam problem. There was a time, fifty years ago, when
ignorance was evident, and surely boredom and tedium, but the intent was more
direct and a student could learn to please the teacher without having to lie to
himself or to outguess some deliberately evasive language of his teachers,
making it hard to find a correct answer, or – in the other direction – some
deliberately revealing language, that immediately advertises the correct answer
without troubling the student with having to know anything. Sometimes these faults are not even
deliberate, but are the consequence of ignorance on the part of those who framed
the questions. We shall see examples of
all four sorts of infelicity in our examinations. It is true that mere facts and canned procedures, however
definite and relevant to the desired instructional results they may be, are not
an ultimate good in mathematics instruction, and are rightly condemned when
they are the sole material of school examinations; but what has replaced these
things is worse.
Carelessness
and ignorance are often present, but are
not the only distressing characteristics of the illness in mathematics
instruction I see evidenced in the exercises and examinations that accompany it
today. More intrusive and abusive are
some subtleties that are simply not noticed, or – if noticed – not believed by
the testing professionals to be deleterious, and yet which I count a greater
danger than to the instruction these tests are intended to measure than the
general “dangers of high-stakes testing” so loudly and dishonestly averred by
demagogic opponents of the public oversight of educational success and failure. A more complete characterization of the evil
I have in mind will be easier to explain after some examples have been probed
at some length.
I shall
therefore begin by describing in detail a few of the problems found in just a
few minutes’ search in three locations that have had interest for me. They do not represent an exhaustive search
for the best examples, but they are more than enough, even though it was not my
intention, when I first went to the three sites named below for other purposes,
to write an analysis of their offerings.
I went to the first one, CMP (“Connected Mathematics Project”), to see
for myself what improvements they had made on the first edition of their middle
school program, for I had been told that CMP now claims to have answered some
of my mathematician friends’ criticism of important missing content in their
first edition, one of the neglected subjects having been the division of
fractions.
I went
to the second web site, the one for the New York State Regents Examinations,
because I live in (upstate) New York and have had some connection with persons
associated with these tests in the past year, and with the controversy
engendered by the 2003 Math A examination, which had caused an unusually large
number of students to fail, and which turned out to have had some plainly
faulty questions. So embarrassing were
the results that the state appointed a Commission to study the matter, this
Commission comprising (among the certified experts on school mathematics and
testing) a mathematician or two, which the committees that had composed the
examination plainly had not. In the
wake of their report the entire examination system in New York is still under
study, and indeed a new set of State Standards for mathematics is being
written. The succeeding (April, 2004)
Regents’ “Math A” examination is now reported to have been posted on the
Department of Mathematics web site, and I was interested to see if the Regents,
or those they appointed to create examinations, had learned something from the ambiguities that had been pointed
out in earlier editions.
And I
went to the third web site, that for the Michigan statewide mathematics
examinations called MAEP (Michigan Educational Assessment Program), because my
grandchildren live in Ann Arbor and had been subjected to them or their
immediate predecessors two or three years ago, and because Michigan middle
schools are great consumers of the CMP materials, which were produced by a team of five authors, three of
them from Michigan State University.
Thus the MEAP would give me an insight into what the state imagined CMP
had, or should have, provided the middle school children who had used that
program.
I will
admit at the outset that I did not expect to find a good result in any of these
cases, but I insist that examples I present below are those that came up
immediately upon my glancing through the material on offer in each of the web
sites consulted. It was not necessary
to sift through all the newly posted CMP exercises, or all the Michigan or New
York examination questions, to find the kind of thing that exemplifies, and
implicitly defines, the defects in today’s school mathematics philosophy and
instruction, for much of it is immediately visible even in questions that are
correct enough and simple enough to be “correctly” answered by any student who
has learned what the school has sought to teach. But some of it is not even correct, as will appear.
First Example: Connected Mathematics Project (CMP)
The Connected Mathematics Project web site has posted some new
textual material that CMP now features, mathematical items, the division of
fractions for example, that had somehow been omitted from its earlier vision of
constructivist mathematics for middle school students. At http://www.phschool.com/math/cmp/new_student_pages/LB6_BPII.pdf>
one
immediately finds, in Problem 1, a setting of the sort the authors regarded as
a real-life situation appealing to middle-school students: It is posited that a store offers its
customers coupons, some of which when scratched reveal an entitlement to a
discount. Part (c) of the mathematics
question (rubric: 6th Grade skill with
fractions and decimals) reads:
(c) The store conducted a survey to find out whether the scratch-off
coupons had influenced customers to buy.
At the end of the day they tallied the results:
* Would have
purchased the items without the coupon: 556
* Were strongly
influenced by the coupon: 378
* Were somewhat influenced
by the coupon: 137
(i) What percent of the customers was influenced by the coupon?
(ii) Make a graph to show the percentage of customers in each
category.
I was initially unable to answer question (i), and had to
look back a couple of times to see if I had read it right. Yes, it wanted me to say what percent of the
customers had been influenced; but it had not told me how many customers
there were, nor whether those customers who had answered the poll and
admitted influence had in fact been influenced as they had
reported. Upon reflection, and making
use of my own childhood experience answering badly posed examination questions,
I decided that the question must have presumed that all the customers had
answered the survey question, and that they had all correctly recalled whether
or not they had been influenced. But
nowhere did the question say so.
I can,
you know, compute the fraction of respondents who said
that they had been influenced; but this was not what was asked. Surely the authors could have written:
( i ) What percent of the
people who answered the questionnaire said they had been influenced by the
coupons?
and
( ii ) Draw a graph to show the
percentage of respondents in each category.
Distinguishing
between “customers” and “people who answered the survey” would not have been to
introduce difficult notions beyond the capability of middle school students,
nor would it have lengthened the text particularly. And it would have named the population reported on with no
possibility of misunderstanding. “Respondent” is no longer a word than
“customer”, nor more difficult to understand.
It is possibly known to 6th grade students; if not, maybe it should be
taught. If the task is too daunting,
the examiners can avoid it by repeating in (ii) the circumlocution I used above
in ( i ). The second failing, ignoring
the possibility that the numbers tallied “at the end of the day” sometimes err
because the respondent doesn’t really know what he would have done in the
absence of coupons, is a bit more subtle; but it is certainly something that
has been pointed out to anyone who has been given lessons in random sampling
and statistical interpretation, such as CMP and all the other popular
NCTM-inspired math programs have been advocating and including in their
“exemplary” or “promising” textbooks for the past fifteen years.
Is it
pedantic of me to wish for the more accurate wording, and to suggest that there
is some pedagogical evil in the manner of its original presentation? Well, I have never heard of a survey that
obtains 100% response, or for which a reasonable pollster assumes 100% truthful
or comprehending response from those who do respond. In reading the introduction to the coupon survey questions I took
at face value the notion that something about polling was intended, among other
things. But in fact this question had
been placed in the program in answer to a complaint about a paucity in the
first edition of CMP of questions (and instruction, or discovery rituals) concerning
“fractions and percentages”. The writer of this particular question was
trying to ask whether the student understood “percentage”, and could divide
each of the three numbers of responses by their sum, and could graph something
about the results. (It is not clear to
me what a graph “showing the percentages” is, by the way.)
But the
author of this question was not intending something about statistics at
all. He could have asked a
mathematically equivalent question in a direct way, without inventing stores,
coupons and surveys, but the demand for “relevance” and “math across the
curriculum” required him to get into foreign territory, where his expertise in
quotients was insufficient. He
evidently forgot that in another part of his own CMP curriculum the subject of
“statistics”, imagined to be a real-life interest of students, includes lessons
in sampling bias that should address directly the confusion he was here making
between respondents and customers, among other things. Study of bias in sampling consumes a lot of
“reform math” class time, in fact, time that could be used for learning
arithmetic and geometry (or music).
Suddenly, here, in this chapter, all that is
forgotten. Problem 1(c) is about
“fractions and percentages”, you see, so that paying attention to accuracy in
the statistics part of this problem, to be sure to get it right, was not his
duty at the moment. It was as if he had
invented a math problem set in the time of Charles I of England, and had the
Duke of Buckingham flying an airplane at various speeds for graphing
purposes. To the reader distracted by
the anachronism he might say, “Why
quarrel about dates? Today’s subject is
graphs, not memorization of history.”
It
wasn’t until I returned to the CMP web site for a second look that I found out
that the rubric for this example had been “fractions and percentage”, not
statistics, and thus understood the reason for my having been put off the
track. In all truth, the first thing I
had looked for when reading the problem, foolishly thinking it was about a poll
of customers, was the total number of customers, as against the numbers whose
answers were tabulated. And if this had
been a real store with real coupons I’m quite sure the manager who paid real
money for the real survey would also have noticed the omission, for a
self-selected sample is never random.
In short, this problem simply did not give enough information, unless
the student is expected to know that this is a “fractions and percentages”
problem, and that the polling part is a fraud; and that he should in the
process command himself to forget the lessons he learned three weeks earlier in
the chapter on probability and sampling.
He should know, too, that by “customers” the examining authority meant
“respondents”, and that what respondents said they would have
done was (in textbooks and exams) what respondents would have
done, in the absence of coupons.
That
makes a goodly budget of missing information that the student is to intuit before
beginning to exhibit his mathematical skill.
Yet “not enough information” is not the whole story here; there is also
too much information, words added to make the problem richer, more vital, not
the same old gray lists of sums that disfigured the textbooks of
yesteryear. Vital? What could be more tedious and unnecessary
than the information that the results were tabulated "at the end of the
day"? Is this a bedtime
story? Should it perhaps, to make it
more relevant to a youngster’s world, have begun with “Once upon a time”? On the other hand, the problem’s
description of the coupon scheme itself, which I have not quoted in full above,
was woefully verbose, including unnecessary (and sometimes questionable)
information about the way sales taxes are computed when discounts are given,
and the exact sorts of discounts the winning scratched coupons provided,
whatever a scratched coupon might be.
Students not conversant with up-to-the minute forms of merchandising at
American shopping malls would have trouble understanding the setting of this
problem to begin with.
In past
years, before “reform programs” were composed to make mathematics more
meaningful, this problem, or a problem assessing the student’s understanding of
the arithmetic involved, would have been stated something like this:
(i) Given the three numbers 556, 378, and 137, what percentage of the
total is each?
(ii) Draw a bar graph plotting
the percentages on the vertical axis and identifying the bars along the
horizontal.
(At least, this was my
interpretation of what the original question meant by its graphing demand,
before I found out from a correspondent that CMP has published suggested
answers to its problems, and in this case suggested a “pie chart”, with colored
sectors representing the three percentages, along with very detailed
instructions on the calculation of the angles subtended by each of the three
sectors.)
A
student who can answer this question will certainly know what to do when he
grows up to be a storekeeper and counts the customers as they come in and (some
of them) elect to enter the scratch-test sweepstakes. Moreover, the examination will be shorter. And it will be correct, for among other
things it will have explained the sort of graph it expects the student to know
how to plot.
A few words are worth writing about that graph at this
point. The CMP example asked the graph
part in these words:
(ii) Make a graph to show the percentage of customers in each
category.
This phrasing is entirely obscure to a mathematician, let
alone the man in the street. A regular
reader of the newspapers sees graphic displays of all sorts of things every
day, and especially on Sundays, and they come in a hundred styles. What they have in common is that they
illustrate with graphic art something that when given in tabular form or in
words is less easily assimilated, or less decorative. In the present case a “tabular” form might be:
Not affected by coupon
promotion: 51.9%
Strongly affected by coupon
promotion: 35.3%
Somewhat affected by coupon
promotion: 12.8%
(Here I
wondered in passing why the authors of the problem had ordered the three
categories in so strange a way. I, at
least, would have found more illuminating the listing in the order “strongly,
somewhat, not,” or “not, somewhat, strongly”, that is, in order of strength of
influence exerted by the coupon scheme.
Either of the two orderings I have just suggested would make the
display, whatever it turned out to be, more memorable to the reader than a
listing placing “strongly” between “somewhat” and “not at all”. But then, this is a question about
percentage and graphs, not about illuminating displays. Can you imagine the New York Times printing
a graph or similar tabular display concerning family income and giving the
percentage of families having income
(1) Less than $20,000 per year;
(2) Between $50,000 and
$100,000 per year
(3) Between $20,000 and 50,000
per year
(4) Over $100,000 per year
and listed in that order? Not in a million years. But CMP, obsessed with fractions and
percentages, was only playing with polls and graphs for window-dressing, and it
shows.
Actually,
I cannot imagine that a “bar graph” representation shows anything this
“tabular” representation (“not
affected…, somewhat affected…, greatly
affected…”) does not do as well or better.
I wonder if the display I might myself have made in answering this
question would have received full marks.
Long after having made these reflections to myself I discovered that the
new CMP materials do include not only a list of problems, of which this one
about the scratched coupons was a part, but also a later section, “Explain Your
Reasoning”, with space for the student to answer some questions concerning the
rationale for the numerical calculation or graphing he had just exhibited.
In the case of the graphical display, the question under
the “Explain Your Reasoning” rubric was worded, “How did you find the percent
of customers in each category in Problem 1c?
Explain why you chose the particular type of graphic display that you
used. Explain how you constructed that
display.” Taking a stab at an answer I
would have given had this been an examination of importance to my own future, I
could only think that I chose the graphic display I used (the bar graph as
described above) because I had to choose something. How I constructed it (yes,
they asked that, too) should be evident
from the diagram itself, which I won’t reproduce here. I wonder, would it really please my teacher
if in this part of my homework I wrote, “I took a pencil and marked the
horizontal axis with three points labeled “not affected”, “strongly affected”,
and “somewhat affected” and then drew a vertical bar above each of the three
points with lengths 51.9 mm, 35.3 mm, and
12.8 mm.”? This would convey no
more information than the graph itself, were it properly marked, and I believe
a teacher’s requirement that a graph be self-evident is a better lesson than
the requirement for “explanation” of something that itself is intended to be an
explanation.
(A more amusing question appears in this “explain your
reasoning” section of the CMP “Bits and Pieces” addenda to the earlier versions
of its program, this one connected with a problem in division of fractions. It
is associated with Problem 5, which I will not reproduce here, and asks:
“Do you
agree with these computations: 4
⁄ (1/3) = 12 and 4 ⁄ (2/3) = 6?
If so, why is the second answer half of the first?”
My own
view, which I won’t spend much time elucidating, is that the second answer, 6,
is half of the first answer, 12, because twice 6 is 12. What on earth does the book mean by that
question? Probably that when you divide
by 1/3 you don’t reduce things as much as when you divide by 2/3. No, it can’t be “reduce”, can it? Well, something like that, or so I thought
before I was led to the part of the CMP web page containing model “answers” for
its examples. I recommend that the really
interested reader go there, for a quite opaque discussion. Altogether, I think this emphasis on ‘why’
instead of ‘how’ is a pernicious way to teach about fractions -- and a good bit
else -- especially with subject matter quite difficult for the very authors and
teachers of the material at hand. Very
often the only satisfactory answers to “why” questions are mathematical
theorems of considerable subtlety, while other “why” questions, such as this
one about 12 and 6, are either not answerable at all or are fully answered by
the very computation being asked about.)
The
casual assumptions these CMP authors made about the imagined customer survey
conveyed more than one unintended false lesson to the child test-taker. The worst such lesson is that mathematics is
a game of mind-reading. I will describe
other examples below. I see such things
all the time -- en passant -- even in otherwise good exam
questions. The question just described
was not very good in any way at all; it was a simple arithmetic problem of
Grade 6 level housed in an unnecessary setting commanded by the current ideology
of having all school mathematics “situated”. The second false lesson conveyed
by this problem is that mathematics is more complicated than it is. Asking for
a graph of some undefined and thoroughly unnecessary sort, following an
unlikely story of a scratch-test discount scheme and survey studied at the end
of the day, sounds like a probing demand, but it serves only to
confuse.
There
is also a false lesson given the people who use the results of an examination
composed of such problems. (The CMP questions were from a book, not an
examination, but are typical of examination questions as well.) The state of
New York, for example, wishes to use the results of its statewide examinations
to determine not only how each student performed, but by looking at the results
on a statewide level to discover what part of its mathematics program is being
successful and what part needs improvement.
Were this one of New York’s examination questions, expressed as it is in
a farrago of commercial and polling language, the resulting statewide
tabulations would not give it such information as whether it was
misunderstanding of the idea of “percentage” that produced the wrong answers,
or whether is was inability to read a rather complicated bit of English prose. Even in the CMP setting, as evidenced by the
carelessness of the description of the survey, the question, intended only as
an exercise in percentages and graphs, failed to address its own intent sharply
enough.
In the
contested 2003 New York State Regents’ examination the complaint, in the case
of a similarly tangled tale posing as a mathematics question, was that it had
been a test of English, and that Spanish-speaking students not yet skilled in
English were being graded on that which was not mathematics. Of course Spanish-speaking immigrants should
learn English, and even be examined in the schools on their acquisition of the
language, along with the Chinese and all the others, but to paint this
difficulty of the mathematics examination as an “equity” question (which is a
popular objection, though it confuses a poor examination score with some sort
of punishment) ignores the very purpose of the examination. A valid test is one that
reports what it intended to report, that tests what it claims to be
testing. Questions of so mixed a
nature, even were the questions good ones, and even if the questions had been
translated into everyone’s native language, would only provide comparative (as
between one student and another) results relating to a mixture of mathematics learning
and a few other things, some influenced by home environment. The State Education Department would be
unable to determine from these results just which parts of the mathematics
curriculum were being done well, or badly.
On past occasions when I have made complaints resembling
those above, concerning the wording of examination questions, I have been
countered with the scornful, “Well,
everyone knows what we mean, don’t they?”
I have to admit, sorrowfully, that upon reflection (but by no means initially)
I did indeed come to understand what they meant in most such cases; but such a
defense is inadequate just the same.
Authors of teaching programs owe it to the public to say
what they mean, do they not? And they
owe it to the children to teach them, too, by example much more than mere
precept, to say what they mean.
Second Example: The New York Regents’ Examinations
On the most recent NY Math A exam, given in January of 2004 (see
http://www.nysedregents.org/testing/mathre/mathatestja04.pdf
), the following appears:
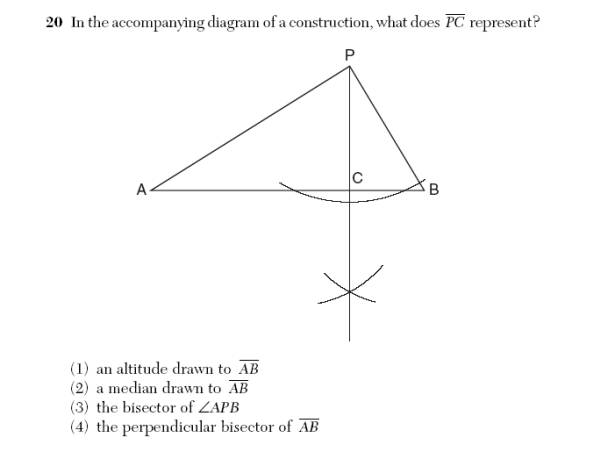
Now the
indicated construction is an arc apparently centered at P and intersecting AB
in an unlabeled chord, and then two more small arcs below the chord (and below
AB), evidently with centers in the two points where the first arc had
intersected AB, so that connecting P with the intersection of the two final
arcs would, if my interpretation of the diagram is correct, produce a line
perpendicular to AB from P. The point
C, pictured between A and B on AB, is the base of this apparent perpendicular.
The
four choices are that the construction is that of:
(1)
an altitude drawn to AB;
(2)
a median drawn to AB;
(3)
the bisector of angle APB;
(4)
the perpendicular bisector of AB;
and
clearly (1) is the desired answer. What
makes the question a bad one is that the correct answer is visible to anyone
with an understanding of the dictionary meaning of the word “altitude”, someone
who needs absolutely no knowledge of Euclidean constructions, of triangles, or
the nature of circular arcs. A student
can see with his eyes that PC is an “altitude” as (1) describes, even by the
incorrect reasoning that it is vertical.
If the writer of this question had sincerely wished to test
understanding of the construction of an altitude he should have diagrammed an
altitude constructed to a non-horizontal side; lots of correct answers would
have been lost this way. From the mere dictionary definition of “altitude” the
student gets full marks, yet this question is intended to test Euclidean
constructions, not appearances.
Furthermore,
the drawing shows a triangle which is apparently not isosceles, so that the
other three choices are apparently wrong: the very picture shows AB is not
bisected by the vertical line constructed, nor the angle APB bisected. But if the triangle were isosceles, with
sides PA and PB equal to one another, all four answers would be correct, both
visibly and by construction. Yet the
problem does not state that the triangle fails to be isosceles,
something that must be stated if the mathematical falsity of the other three
choices is to be guaranteed.
I would call this question
ambiguous on the grounds that the indicated construction could be what
is described in (2), (3), or (4) if the indicated triangle happens to be
isosceles. The author of the item would
probably argue with me, saying that the picture clearly shows a non-isosceles
triangle. To him I would reply that
Euclidean constructions are not proved by using the “obvious” properties of the
special figure that happens to have been drawn to illustrate the data. It is the duty of the problem author to give
all the needed data, including – in the present case – the statement that the
triangle is not isosceles, or at least that it is intended to represent a
generic triangle (which at the middle school level might be referred to as “any
triangle”). The language used, “in the
accompanying diagram”, invites the student to make his own interpretation of
how general or special a case is intended, since every diagram is
unique, special. (Euclid would write “a
triangle” when he meant a generic triangle.
When he did not, as in the Pythagorean Theorem (I;47 of Euclid’s Book
I), he explicitly referred to a right triangle, and not to a triangle
“as pictured”.) Without precision there
is no mathematics, and no way to apply what one thinks the theorems say. Even the pictured arcs of the NY Regents
problem are not described in words, which they should be; the author simply
knew that students taking the New York Math A examination had by state
standards been exposed to this particular construction, and so didn’t think he had
to ask a complete question. “Well, everyone
knows what we mean, don’t they?”
In sum, this question really didn’t test whether the
student had remembered this construction or why it worked; all it did was
offer, by means of its presentation, a multitude of
mathematically irrelevant clues to the correct answer. A serious question about this construction
would have been to ask the student to use straight-edge and compass to construct
an altitude from P to side AB? The Math
A examination does after all have a place for “extended response” questions,
and that would have been the place for this one.
It is
my belief that those who presented this problem in this (multiple-choice) way
did not want to take the chance that anyone would get it wrong. This anxiety for high (or “passing”) scores
on statewide examinations is one of the notable features of today’s
“accountability” pressures now emanating even from national legislation
appropriating money for “education” based on demonstrated success of the
programs being subsidized. The
construction of examination questions that appear to examine knowledge of
things listed in the state standards as published these days in almost every
state in the country, but which in fact “give away” the answer, is a prominent
form of cheating on the part of the educational authorities, and thus one
source of bad exam questions. There are
other sources for the bad examples under examination here, however, and they
are to me more disturbing for the long run than this sort of “pretend problem”,
since they so often reveal mathematical ignorance, and ignorance of good
English usage, both probably harder to conquer in public affairs than mere
guile.
The web
site of the New York Education Department contains copies of all recent Regents’
Math A and Math B examinations (Math B being voluntary and more than the
minimal needed for a high school diploma) at http://www.nysedregents.org/testing/hsregents.html,
and there are sample problems
from tests at or below the Grade 8 level on other parts of the site. At http://www.emsc.nysed.gov/osa/testsample.html
the menu offers a link to “High
school math” sample problems which turn out to be samples illustrating the
intended level of questioning for the new Math B examination, which at the time
of posting (1999) had not yet been given.
These particular examples were never used on the actual Math B
examinations, which commenced in the following year. It was fortunate for the state that they were not used, or the
state would have found the public response to Problem 1 as embarrassing as the
response to the ambiguities of the Math A examination given in 2003, which received
such coverage in the newspapers that a Commission of enquiry had to be
established. If there is no public
outcry, however, the state is hard to shame, as I discovered from my mainly
one-sided correspondence concerning Problem 1 of the Math B sampler.
The
State’s answer to my first letter didn’t address the question of whether the
problem was correct or not, but stated that the example as printed could not be
withdrawn or changed because the scaling of scores on later Math B examinations
depended on the recent use of these sample problems in trial runs, and if any
question were now changed the scaling would have to be done again. To my second protest, that the problem was
wrong, egregiously wrong, and a disservice to the public whatever scaling system
adjustment they might have to make upon withdrawing it, got no answer. The State is presumably still using these
sample questions, and the statistical analysis of responses, for some purpose I
can only guess at.
Here is the problem, exactly as
found at the “samples” website mentioned earlier: http://www.emsc.nysed.gov/osa/testsample.html .
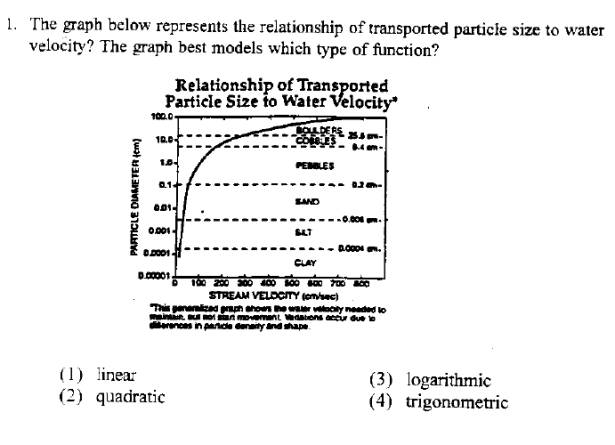
A
thoughtless glance at the graph will suggest the familiar contours of a
logarithmic function graph, assuming it were plotted on a Cartesian plane with
equal spacing in the vertical and horizontal scale markings. The composer of the problem (not the
composer of the graph, which is clearly reproduced from a scientific source)
was thoughtless indeed, for the axes are marked carefully: the stream velocities are 0, 100, 200, ... ,
800, equally spaced horizontally; but the vertical axis has particle sizes
.00001, .0001, .001, .01, .1, 1.0, 10.0, and 100.0 (mm) also spaced
equally. This is not a linear scale; it
is a semi-logarithmic graph, as is useful in engineering applications. In such a graph a straight line would
represent the exponential function, and the graph actually shown is the graph
of something more like a linear function, as one can see by tabulating some
paired values, i.e. coordinates of points on the graph.. Not exactly, as I discovered by taking
actual measurements off the page, but a great deal closer than logarithmic.
Were I taking the examination would I answer “linear”, which is choice (1),
closer to the truth than the “correct” answer (3)? No, on second thought I would realize the examination-maker’s
error and give him the answer he wanted.
Why make trouble?
It is
my belief that the person or persons proposing this problem were not only
careless, but were actually deeply ignorant, not to have noticed that the
non-linear scaling of an axis on a graph makes a difference in the shape of the
graph of a function. Apparently all
they knew about “logarithmic” graphs was the shape, and this is all they
expected of the students, too. The fact
that a function is defined by the functional values, not the picture,
never entered their minds, though I suppose close questioning might have taught
them something they hadn’t been thinking of before. One could, to clinch the point, make a polar plot
of the logarithm function, via the equation r = log(θ), and the result
would be a spiral of a rather unfamiliar kind.
Would they say this was not the graph of the logarithm function because
it had the “wrong shape”?
A year
or two later, with this erroneous example still on the web site, I revisited
the New York Regents examinations and looked up the Math B examinations as they
had actually been given statewide, to see if at least in the serious business
of grading children they had finally got the lesson straight. Well, they had cured the problem, in a way.
In one exam they exhibited pictures of four graphs (see below), no
longer real-life graphs taken from science somewhere but a made-up graphs such
as one sees in textbooks, with the same four familiar shapes. But they took no chances on scaling them.
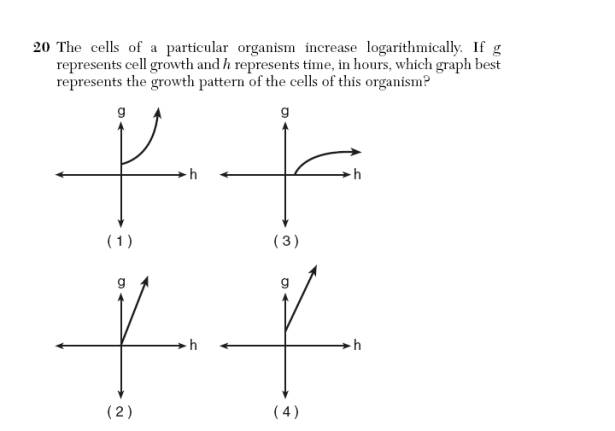
“The
cells … increase logarithmically” is obscure to me; do they mean the number of
cells? And what is “increase
logarithmically”? Is a formula of the
sort “y = 3 + log (x+1)” a formula of logarithmic increase? If it is,
(1) and (4) would be acceptable answers if the scales were interpreted
with suitable guile. Whatever they mean by cells growing logarithmically, the
absence of printed coordinated scales to trip them up saves the day; it is
clear that, by New York State Regents standards, (3) is the logarithmic graph,
and must be the answer.
In general, the New York Regents Math B examinations that
have actually been given do not have any graph recognition problems as
egregiously incorrect as the sample question about the velocity of particulates
in running water; the “logarithmic growth of cells” problem just under
discussion being ambiguous rather than wrong.
But graphs without indication of scale are common, not only in New York,
but in the Michigan examinations called MEAP, some examples from which are
discussed below. While it can be found at the MEAP web site mentioned below,
where other MEAP questions are discussed at greater length, it seems
appropriate to insert this MEAP “high school” level problem here:
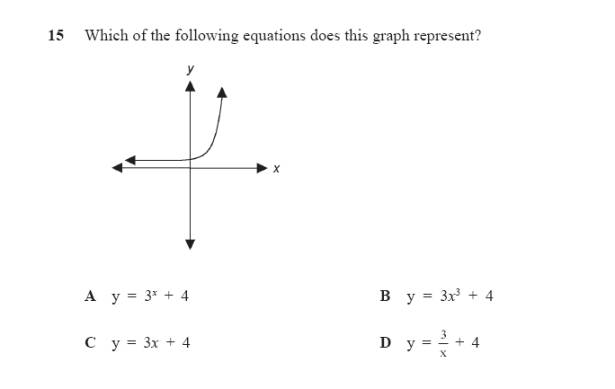
And
every year now, year after year, a version of this problem occurs on
examinations all across the country, with no coordinates marked. Teachers have come to take such “shorthand”
for granted; absence of a coordinate indication has a schoolbook interpretation
of “imagine Cartesian coordinates with equally spaced integers marked in as a
scale indication.” A mathematician
might accept such a convention when writing something on the back of an
envelope in discussion with a colleague or student, if the point was to
illustrate the way linear functions behave (straight line graph in the usual
Cartesian scheme) as against the cosine, say, which has a familiar periodic
oscillation, up and down; but he would know immediately how the graph would
have to be modified if some other scaling were used, while the school
exam-maker has nothing else in mind than to repeat the tired questions of
yesteryear and wait for retirement.
“Save
one who, stout as Julius Caesar…” Yes,
one courageous New York education official, taking too seriously the NCTM dicta
about making mathematics relevant, vibrant and true to life, went out and found
a real graph about real particles and stream velocities, a graph that looked
somewhat like what he had been calling “logarithmic” all his life for
schoolroom purposes. Though I cannot be
sure my letters to Albany convinced him, or them, that they had been wrong to
do so, someone seems to have noticed and not repeated that particular error,
but I cannot say I am pleased to see the way the actual Math B examinations have repaired the
unintended consequence of going to real-life for “real-life” problems. They have instead (I should have known!)
returned to old-fashioned ways, and are again judging students on how well they
know how to produce “correct” answers to literally nonsensical
questions, using visible graphs of “functions” having secret inputs and
outputs. Even if the exact scales are not marked on a problem of this sort, it
should be indicated by unlabeled marks that the x and y axes have identical
scales if that is the intention. To put
actual numbers on those marks might give away the answer to any student astute
enough to check some values with a calculator (these are often permitted on
examinations), in order to eliminate the wrong graphs, but this maneuver would
be made more difficult with the compromise convention of indicating comparable
scales for the axes. All this assumes
that the intent of the question is to know if the student recognizes the
behavior of the common functions appearing in elementary applications. If the intent is to make it easy for
students to score points, however, the present system suffices.
Returning
to New York now, but to the web site http://www.emsc.nysed.gov/osa/mathei/matheiarch/gr8bk1math.pdf
we find at the Grade 8 level
questions of such simplicity that the state should be shamed, not only for its
high rates of failure, but for setting its standards so low that the public
believes it is -- even with its high failure rate – more successful in its
mathematics programs than it really is. (This examinations is footnoted as
having been created by the publishing company McGraw-Hill, though © 2002 NY State Department of
Education.) Samples:
4. What rational number is the multiplicative inverse of 3½?
F 2/7
G - 2/7
H 7/2
I - 7/2
This question is mere
vocabulary, a fossil from the days of The New Math, and certainly not
indicative of any ability or skill in mathematics. It separates the children who went to class at all from those who
didn’t, but no more so than a question about the name of the war going on
during the presidency of Franklin Delano Roosevelt. As for the vocabulary itself, “multiplicative inverse” and
“rational number” can have no function beyond making the question sound
profound. Well, it has another
function, which is to give warrant to the wasting of class time during the
semester making sure children can pronounce those words and use them correctly.
If
Question 4 were rephrased as follows it might have some point: “For what number A is the product of A and
3½ equal to 1?” My belief is that the
question is not put this way because it would then be seen to be a Grade 6
problem rather than the advertised Grade 8. Indeed, I suspect fewer people will
get this correct than the question as posed, concerning “multiplicative
inverse”. Indeed, the rigidity and
futility of traditional mathematics instruction is evidenced by the fact that
the some students are able to answer a question about “multiplicative inverse”
without really understanding what it is all about, which my rephrased version
would uncover – should anyone really be interested in uncovering it.
The
following question on that same New York examination is:
5. Which number is
equivalent to the expression below?
| -15+4 |
A -19
B -11
C 11
D 19
This one is equally trivial, though it does ask for the
meaning of “absolute value”, and the recognition of the symbol denoting it;
these are sometimes thought to be difficult for students. Upon examination, however, any difficulty a
student might have with the idea as here illustrated can only be due to the
pedagogical ineptness of his teacher, or (much more likely) the unnecessary
elaboration of the definition of “absolute value” as given in traditional
textbooks, themselves often victims of “new math” elaboration from the 1960s,
where the definition
|x| = x if x ≥ 0, and |x| = -x if x ≤ 0
was
popular, though indeed hard to understand at first reading. At the introductory
level it is much more
illuminating to say |x| means the (positive) distance of x from
zero. With such teaching, along with
the interpretation “|x-y| is therefore the (positive) distance between x and y
on a number line”, from which one obtains that |x-y|=|y-x| for any two numbers
x and y, all difficulties with “absolute value” tend to evaporate, and yet
these definitions are quite as mathematical, once numbers are identified with
distances, as the technical one exhibited above, whose value only appears in
more advanced contexts anyhow. Not that
the story about |x-y| is needed in answering this particular question. With the
distance interpretation it is clear that the answer to problem 5 is C (i.e.
|-15+4| = |-11| which is 11), while for some reason the bipartite definition
still commands a following among textbook writers, and exam writers, who should
long ago taken this particular sad lesson from the troubles of the 1960s more
seriously.
Like
its predecessor, this “problem” (Problem 5 above) is made more impressive than
it deserves by its use of the word “equivalent” in place of “equal” or “the
same as”. That, too, is a hangover from
“The New Math” of the 1960s, when “equivalent” had a meaning in connection with
the sometimes necessary distinction between symbols and what they represent, a
distinction that has now been totally lost in what now remains of the school
mathematics of that time. If the
question had begun, “Which numeral …”, and if the distinction
between numeral and number, so popular and unnecessary in those days were still
part of the curriculum today, this verbiage would have some point to it, but
its use in the present context illustrates only that the writer was searching
for ways to sound deep while asking nothing worthwhile. A problem in which the absolute value symbol
was actually of use would tell us something; this one does not, except as a
ghastly reminder, once the state grades are tabulated, of how badly our
children are being taught.
A good example of another sort of problem, very
common in a time when everyone must seem to succeed, one so trivial as to be a “give-away”, is # 25:
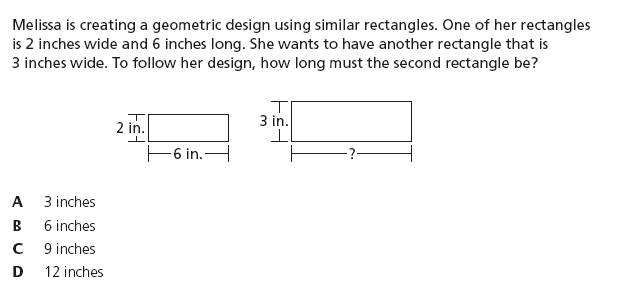
Clearly the question can be answered (9
inches) by anyone with half an eye, whether or not he knows what similarity
is. All he has to do is to believe the
picture. If the state really wanted to
know whether its 8th grade (Eighth grade!) students understood similarity and
ratio, and how to handle rational numbers, it could have made the three given
lengths 2, 5.7, and 3, instead of 2, 6,
and 3, and offered as its choices labeled A, B, C, and D four numbers closer to
each other than a look at the diagram could distinguish – and the problem would
still be simple enough for examination purposes. A syllabus that claims to include ratios and fractions is surely
entitled to consider even more complicated
fractions than these. No child can be a carpenter until he learns that much, at
least; and this is 8th grade arithmetic, not quantum theory.
Third Example: The Michigan MEAP
The State of Michigan has an examination system called the Michigan
Educational Assessment Program (MEAP).
Released questions, with answering rubrics in the case of extended
response problems, are found for recent examinations at
http://treas-secure.state.mi.us/meritaward/mma/released.htm,
the “merit award” part of the
URL for this site referring to the fact that good scores on these examinations
lead to state awards of money for college tuition.
I consulted, at this site, the sampling of MEAP Grade 8
math examination questions administered in April of 2001 and the sampling of
“high school” level MAEP examinations questions for 2002, which were among
those provided there as a public
service, aid to children and teachers who wish to know what to expect in
subsequent testing. I made notes on the first five problems of the 2001 test,
which were multiple choice, and Problems 15 and 18 of the 2002 test, for the
discussion I give below.
[Added
April 29, 2004: The Michigan web site
referred to above now no longer contains all the information it had when this
paper was written, and might well contain nothing at all when the reader of
this paper gets to it. In particular,
Problems 1-5 of the April, 2001 MEAP Grade 8 level examination, which I will
later be using as examples, are no longer on exhibit. The other two I shall exhibit,
Problems 15 and 18 of the 2002 “high school” mathematics test, are still
there.]
From the 2001 Grade 8
Examination:
Problem 1. In which set are the numbers equivalent?
A. 1/3, 3/27, 33%
B. 0.090, 90%, 0.90
C. 88%, 88/100,
22/25
D. 0.66%, 2/3,
66.7%
This question actually does measure something (C is
correct), though it is made unnecessarily easy to answer in that each of the
wrong answers contains either a downright howler of an error or a
superabundance of errors: In A it
should be known (by the 8th Grade – when a good school program is already into
algebra) that 1/3 is not precisely 33%, for example, this alone is enough to
eliminate A as the answer. But 1/3 is
also not equal to 3/27 which is 1/9, and 1/9 is surely not 33%. The student thus gets three chances to see
that A is not the answer, so that even if he knows nothing of the reduction of
fractions to lowest terms, or has no understanding of “percent”, he can still
eliminate A. D also has all three
entries different from one another, more than needed for elimination. B, which requires no knowledge of fractional
notation at all, is the best “distractor”, for it isolates a common misreading
of decimally expressed numbers among young children and illiterates, but while two of its entries are the same the
elimination of B requires only understanding of decimal notation and no
knowledge whatever of “%”, let alone
fractions. C is therefore all that remains.
Well, it is an easy problem, though it belongs at the 6th
grade level rather than at the 8th (for which it was intended), and can be
correctly answered by students having no understanding of fractions or of the
word “percent”; but this is not all that one can criticize in the text. Why the words “set” and “equivalent”? Well, “set” is a pretty ordinary English
word, and each choice features a set of three numbers; but there is here
another disturbing echo of the language of “the new math” of the 1960s, where
“set”, “number”, “numeral”, “equal” and “equivalent” were the meat and potatoes
of advanced pedagogy in the schools – and usually, as in the present case,
garbled.
The
“new math” distinguished carefully between “numeral” and “number”, a numeral
being a symbol representing a number, while a number was an ideal object in
one’s mind. The distinction is
necessary for fully logical discourse, in serious linguistic and philosophical
discussion, but even among mathematicians only observed when the distinction
itself is the subject of the discussion, and the attempt to be rigorous in such
matters is often to tedious to bother with when numbers are being spoken
of. The number “three” is a
mathematical abstraction, and there is only one such object in the
universe. Everyone knows what three is,
though the writing of it might be “III”
in Roman numerals, “5-2” in the middle of some calculation, and perhaps
“300%” where percentages are construed as numbers. The three examples I have just given are examples of different numerals
denoting the idea of a triple or triad.
Moreover, they are equivalent numerals.
As numerals they cannot be equal, for they are of different
appearance, size and perhaps color, since equality means identity in
arithmetic; therefore in the context of the sort of precise language
promulgated by the logicians of “new math”
the numerals “5-2” and III were called “equivalent”. Two numbers are either the
same or not the same; there is no other “equivalence” in ordinary arithmetic, and
mathematicians freely say things like “1/3 = 2/6” when they mean that the two
different numerals just written represent the same number.
The
idea of equivalence (not equality) of numerals takes on particular
importance when fractions are in question, for as fractions, the symbols
1/3 and 2/6 are surely quite different, though they are equivalent numerals in
that they represent the same number.
Recognizing and creating equivalent fractions is a necessary skill in
the arithmetic of rational numbers, for it is at the bottom of all practical
calculations concerning fractions. In
adding fractions, especially, one looks for a “common denominator”, that is,
one looks for two fractions equivalent to the original two being added, but
with the replacement fractions having the same denominator; only after these
have been found is there an easy calculation for their sum.
Now,
“rational number” and “fraction” are often used interchangeably in daily
conversation, and this is not harmful, and
it is true that too much was made of all this nomenclature during the
1960s. Unfortunately, many a child (and
teacher, and writer of so-called “new math” textbooks), unnecessarily drilled
in it learned it incorrectly, so much so that the whole movement towards precise
language in the formulation of mathematical statements got a bad name. I would
not wish to include exercises in “number” vs “numeral” in today’s 8th
grade curriculum, but people who do have occasion to use such words should
understand them and use them correctly.
The author of Problem 1 of the MEAP 2001 8th Grade examination was
evidently one of those who did not. The
word “set” must have frightened him into recollection of the days of
“equivalence” and “numeral”, but not enough so that he got it all right in the
present case. The four sets which made
up the choices in this problem were in this case really sets of numerals
to be tested for equivalence, in one of the few contexts in school mathematics
where the distinction between number and numeral makes a difference; but after
all this preparation he called them “numbers” anyhow! Sad. With a little less
pretension the author of this simple problem should have written, a bit
colloquially but quite correctly in today’s mathematicians’ lexicon as well as
the language of commerce and engineering,
“Which of the four groupings below exhibits
three equal numbers?”
The MEAP Problem 2 is mathematically entirely trivial,
though its statement fills the page with diagrams and symbols. It is typical of such exams to do this. Here is depicted a coordinate system with a
circle inscribed in the square of side length 6 nestled in the first quadrant,
the circle therefore tangent to the
sides of the square at (0,3), (3,6), (6,3), and (3,0), with a
(horizontal) diameter drawn through the points (0,3) and 6,3). The picture is given, with all the points
mentioned signaled by heavy black dots as well as the coordinates written
out. The text reads:
Problem 2. Which
coordinate point satisfies the following requirements: It serves as the endpoint of the given
diameter, and does NOT lie on the y-axis?
and
the four exhibited points of tangency, (0,3), (3,6), (6,3), and (3,0) as listed above, are given as the four choices
for this multiple-choice question. So roundabout a method of determining
whether the student knows the point notation for the Cartesian coordinate
system, is able to recognize the words “diameter”, “endpoint”, and can discern
when a point is or is not on the y-axis is embarrassing. The problem might confuse someone new to the
English language, but even this is doubtful.
It serves only to divide the totally illiterate into two groups: the 25% who guess right, and the 75% who
don’t. Maybe there is some value in
finding this out. Let us go on to the
next one.
Problem 3. Winona took five chapter tests. The table shows her scores:
Test 1 2 3 4 5
Score 86 90 80 79 70
If
Winona retakes Test 5, what score would she need to have a mean score of 84?
This problem is common and all
students are drilled on it these days, though it is generally given in a
slightly different form. The score
Winona already achieved on Test # 5 is totally irrelevant here, since that
score is to be replaced by her “retake” score, so that the question could well
be reduced to the following: “Given the
four numbers 86, 90, 80, and 79, what fifth number would make the mean of the
five numbers equal to 84?” More often
the problem of this type merely doesn’t give the original score for Problem #
5, but offers the first four scores and asks what score is needed on a fifth
exam to make the average (or mean) score 84. I believe the words “Winona”,
“chapter tests”, and “retake” are confusing elements in the statement of the
problem, which trumps up the story for “real-live” flavor only, and that some
students will be sufficiently distracted to make some error they would not make
in the simplified re-wording I have just offered. Probably the most common error would be in misconstruing the
phrase “retakes Test 5” to mean “Take a sixth test to make up for Test 5, by
averaging it in with the others”. One
could even make a case for such a technical use of the word “retest”, and for
such a use of a sixth test as a compromise between giving a chance at replacing
Test 5 and not giving a second chance at all.
Unlike
the composers of several of the earlier examples, whoever made this problem was
not trying to make it easy to score points, but was asking a good
question. However, he should have
thought more carefully about what is really being looked for in asking this
question in this form, for it offers several avenues to error, most of
them having little to do with mathematical competence. As with the CMP example of the scratch test
coupons and the polling described earlier, teachers and others who wish to
evaluate school programs by making an “item analysis” of the errors on a given
administration of an examination will not learn much from trying to classify
the students getting this one wrong. It
would simply not be clear from the mere erroneous answer just what it was that
is lacking in the student’s understanding.
On the other hand, it might be that the examiner really wanted to be
sure the student was able to handle a multistep problem and wise enough to
ignore the irrelevant data; therefore I am not here condemning the
problem. It is probable that the
examiner intended the solution to be written as follows:
(1/5)( 86+90+80+79+x)=84; solve
for x.
This would exhibit an early use
of algebraic notation and its value in finding an unknown quantity specified by
the conditions. The problem, by the
way, can also make a good mental exercise for classroom use: One notices that the total deviation from
the desired average (84) is 2+6-4-5, or –1 points on the first four
examinations; hence an extra point (above the desired average) is needed for
the fifth examination, i.e. the fifth score must be 85. Check: 86+90+80+79+85 = 5X84, sure enough.
However, the problem was multiple-choice! If CMP is the expected middle school program
behind the syllabus for this particular MEAP problem, calculators will be used
for this examination, and then, of course no algebra or ingenuity will be
needed for this problem. The student
has only to compute the average, using each of the offered choices; if it is
not 84, change the guess. If Michigan
were really serious in its enthusiasm for calculators when used
“appropriately”, as the phrasing of today’s state standards almost invariably
has it, it would ask a question of the sort:
”What score would Winona need on her fifth examination to end the term
with an average of exactly 85.5?”
and require a written answer,
perhaps warning the student that the required score might not be an integer.
Problem 4. As a reward for good behavior, Mrs. Rafferty
writes student names on tickets and stores them in a container. At the end of the week, she draws a ticket
for a reward. Hans has 6 tickets in
this container. The container has a
total of 48 tickets for this week. What
is the probability that one of his tickets will be drawn?
A. 1 out of 6
B. 1 out of 8
C. 1 out of 48
D. 1 out of 54
This one is quite trivial, though not incorrect except for
some stickler who might (like me) prefer the language of probability (“1/8”,
rather than “1 out of 8”, in the correct answer). Even so, the list of answers should have been improved to include
the incorrect, though attractive, choices “1/9” and “1/7”. If students at this level are to be taught
this little about probability, they should at least be taught the difference
between “probability” and “odds”, a distinction important to daily life. The odds against Hans, in race-track
language, are 42 to 6, or 7 to 1. I
believe the really significant “distractor” would be “one out of seven”, though
“one out of nine” would have its proponents, but again this would be to make
this problem too difficult to guess. Of
course it would not make the problem a whit different. Again we
have a case of window-dressing complication covering extreme guessability.
The hypothesis that all tickets
have an equal chance of being drawn is not mentioned, and in fact it is the
sort of thing that is taken for granted in problems of this sort. If one looks at the state standards for most
states, however, one will find under the heading of statistics and probability
the demand that students be on the lookout for sources of bias in polling, and
sources of inequality in the probabilities of disjoint outcomes of some
experiment. Such instructions are
seldom followed up, as this example shows; still, if the subject is mentioned
at all it ought to be demanded that students learn at least the language of
equiprobability, and that an urn problem such as this one include the phrase
“where all tickets have equal probability of being chosen”, or “chosen at
random”. Why should students be
expected to understand scratch coupons and not “at random”? The school should teach mathematical
language when it can, or at least use it.
Eighth grade students need not learn about conditional probability, but
it can’t hurt to point out that there are other possibilities than
equiprobability in games of chance.
Problem 5. A
triangle has 0 diagonals, a quadrilateral has two, a pentagon has five, and a
hexagon has 9. If the pattern
continues, how many diagonals must an octagon have?
Sides 3 4 5 6 …
Diagonals 0 2 5 9 …
Now I happen to know, and can prove, that an octagon
(convex, by the way, since a non-convex polygon might have strange looking
“diagonals”) has 20 diagonals, whether or not the pattern exhibited with the
question “continues”. The composer
of this problem knows (or should know) that the usual proof of the formula for
the number of diagonals depends on a recursive analysis which shows that the
first differences in the sequence of numbers of diagonals, {0,2,5,9,…},
continue to increase by one. The
reasoning is intricate, however, so that the test-maker, in his role as
point-maker for students, makes it easy for the student to answer the question
by recognizing the partial sequence he has given as data as being of that
nature. With that reassurance from the
test-maker, the student can forget everything he ever knew about polygons and
still answer the question, for this problem is only illusorily about polygons
and the recursive reasoning involved in counting their diagonals.
But bad as the problem is for its announced purpose, it is
worse than that, for it says, “If the pattern continues …” It might look obvious that the pattern
continues with first differences increasing by one, but it isn’t; no finite
sequence without a stated rule has an obvious continuation. The second error is semantic: The number of diagonals of an octagon is 20 whatever
the sequence does. What would one
answer to this question, for example, “If the pattern does not continue,
how many diagonals does an octagon have?”
An octagon has 20 diagonals no matter what. From a technical point of view, taken from the
first-order prepositional calculus, an irrelevant or incorrect hypothesis can
yield a correct conclusion, but the conclusion in real-live terms derives from
something other than the putative hypothesis.
“If the sun goes around the earth,” one might ask, “ then how much is 2+
2?” Question 5 is just another in the
link of semantic confusions that beset the teaching of elementary mathematics
and reinforce every day that popular view that the study of math is a can of
worms. That the injury accomplished by
this wording of this question is subliminal – hardly anybody would notice this
one, after all – doesn’t make its damage any the less.
Turning
to the “high school” level Michigan problems cited as samples by the state,
Number 15 has already been reproduced above as a footnote, as it were, to the
New York Regents’ suppression of embarrassing inclusion of coordinate scales in
a problem asking for recognition of the graphs of common functions. The other one I happened on also serves as a footnote to an earlier
complaint concerning a middle school problem about probability:
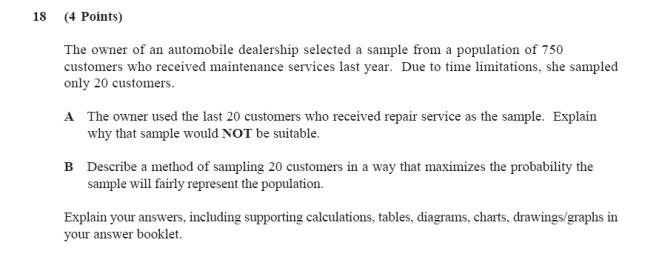
My complaint was
that a certain middle school problem failed to mention an equiprobability
hypothesis. There were 48 tickets in a
box, of which 6 were winners, and the question was, what is the probability of
choosing a winner? My colleagues
sometimes say that one ought not, in such examinations, say such things as that
the probability of choosing one ticket is equal to the probability of choosing
any other, but I say that the schools do claim to teach the necessity of such
mention (to ordinary students) even if it does not get brought up
systematically, and that it behooves the state to make mention, at least of
such possibilities as soon as probability as such gets mentioned. As evidence I cite the question above, where
the student is asked to imagine reasons why one sample of 20
customers might not be a random choice.
While a full-scale treatment of the statistics of sampling is not
intended by Michigan even at the high school level, surely this question is
evidence that the state wishes students to take cognizance of non-random
possibilities.
Unfortunately,
the answer rubric is typically poor.
Examples are given of actual student responses, with the deserved score
(0, 1, 2, 3, or 4 points, 4 being full marks) for each. The first response is handwritten and not
reproduced below, but was scored 4, with the Michigan explanation of the reason
for the full marks printed as follows:
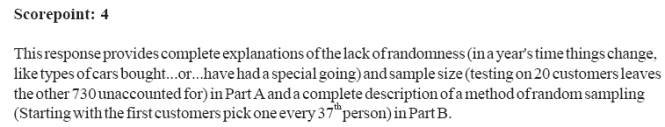
The flat-out statement that a sample of 20 from a
population of 750 is necessarily an insufficient number because that leaves
“the other 730 unaccounted for” is very bad statistics. I would much prefer that the schools omit
statistics from the ordinary, non “Advanced Placement” mathematics sequence,
and include more arithmetic, algebra and geometry.
Final Example: Let Everyone Pass
One last typical example, from NYS Regents web page: Sample Grade 8 problems. Grade 8; imagine! Problems like this one are
called “guess and check”, and the method is taught by every teacher who is
compelled by the Principal to avoid mathematics and have the children get good
test scores. Sometimes the last three
weeks of the year are spent reviewing point-getters like this one, and the
Education Department in Albany makes sure that every child gets enough of them
to succeed in school, whether or not he knows anything about mathematics. Here it is:
Problem # 13.
Bill picked 1/2 of the apples on his
grandmother’s tree. After Bill finished,Sally picked 1/3 of the apples that were
left on the tree. After Sally finished,there were 40 apples left on the tree.
How many apples were on the tree before they picked apples?
A
40
B 60
C 80
D 120
How
much arithmetic would a third-grade child of a hundred years ago have
needed to know to be able to reject A, B and C? No more than average, if that. There were forty apples left after
more than half had been picked! Again,
the provision of obviously inappropriate distractors makes the answering
easy. As a real problem, with the
student asked to calculate the answer without being given strong hints for
guessing, this would not have been a bad one, even though the algebraic
formulation should not be beyond the power of an 8th grader. All he has to do, even without the wrong
choices being as wrong as they are, is to try them out. Start with 40: Take away half, then take away a third of the result; can there
be 40 left on the tree? Start with 60,
and go through the same ritual. And so
on. Even with the worst luck, using 120
after failing to succeed with all three other choices, the answer is soon
arrived at, with nothing but the most elementary arithmetic.
Ralph A. Raimi, June
3, 2004